Reports Your Way: New Customization Features

If you’re already a user of GradeCam, it’s likely you know how easy it can be to scan assessments and transfer students’ scores to your online gradebook. Today, however, we’re introducing two new reporting features that will streamline and more clearly define your data:
- “Favorite” your most-used reports
- Customize performance bands

Favorite Reports
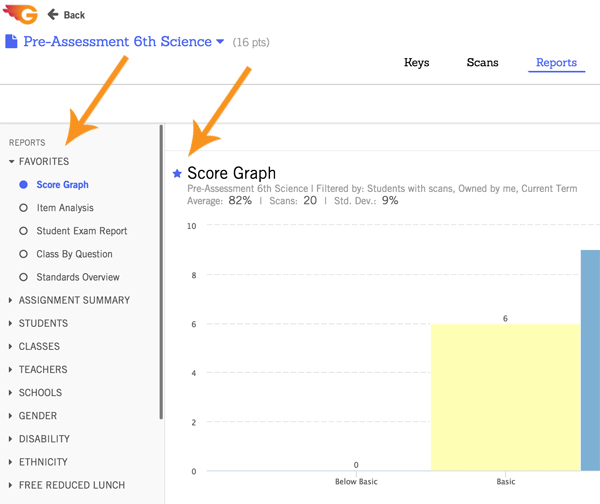
You can now save your favorite reports in one place for quick access to the data you use most. Just click the star next to the report title and it will appear in the Favorites category at the top of the left-hand Reports column. No more scrolling or clicking around to find those reports you return to again and again!
Performance Band Settings
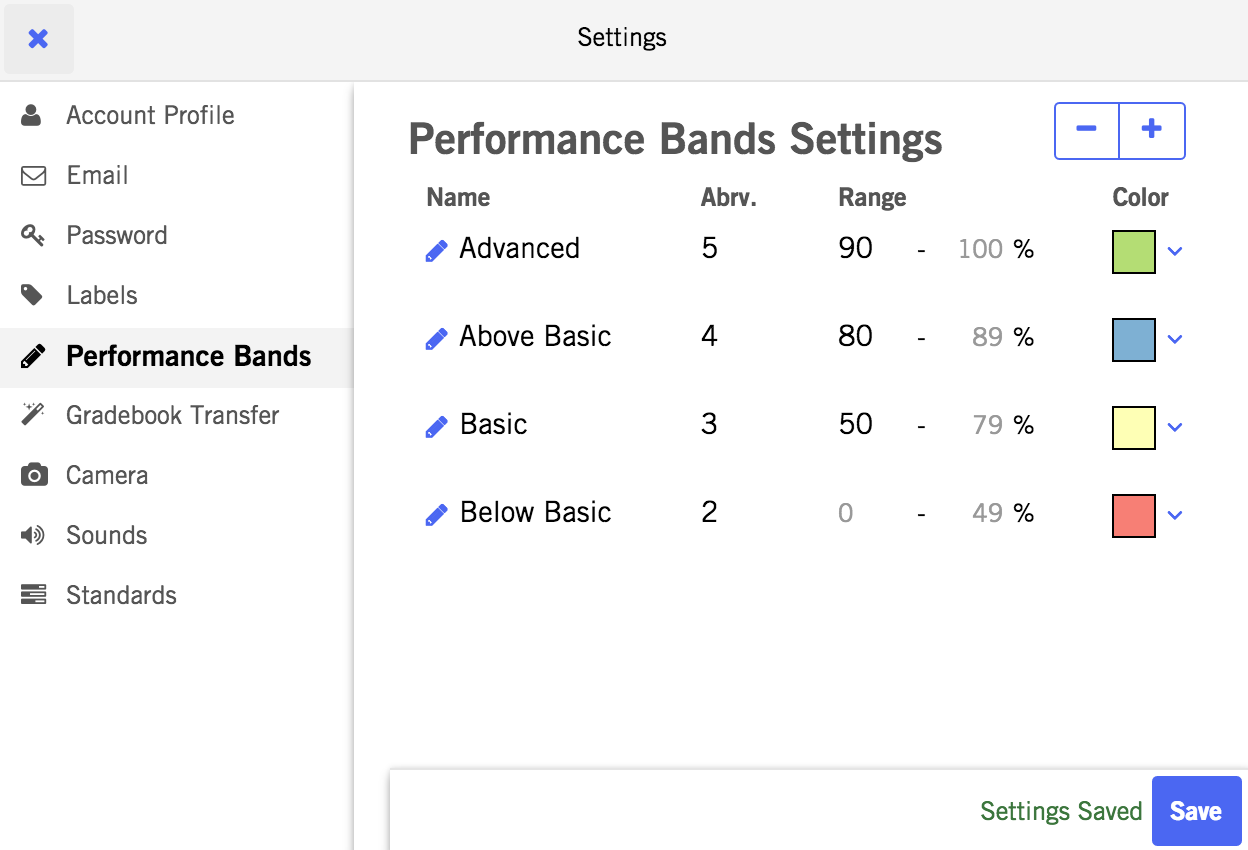
When viewing individual assessment data, you can now customize performance bands to meet your needs. You can change the name, colors, and percentage range the bands represent, and also add or delete bands altogether. For example, if your school district range for an A is 93-100%, you can easily go into the settings and adjust the scale for your needs.
Access the performance band settings by clicking on the main menu (your name in the top right corner) and then Settings. In the pop-up box, select Performance Bands from the left menu.
Reports = Your Data Arsenal
We understand that one size doesn’t fit most, so GradeCam includes a bevy of report options to meet a variety of teachers’ needs.
- Choose to view how the whole class is doing over the term, for one assessment, or even one specific question on an assessment.
- View student progress over a specific term, down to a specific standard
- Assign standards to questions and track that data longitudinally
- Pull out data based on groups of students or a set of assignments
- And so much more
For more information about our reports, visit our online support desk or attend one of our free live webinars.


Explore what Gradient has to offer.
Experience the full power of Gradient with a 60-day free trial.